
10 Financial Red Flags in Stocks & Warning Signs Investors Should Check: Checklist for 2026


Every accounting scandal leaves a trail. Enron, MCI WorldCom, Parmalat,Wirecard, FTX. Many of those flashed warning signs for months before the stock finally collapsed. The hard part was never that the signals did not exist, it is that most investors weren't looking in the right places.
Below are ten checks I run as an investor before getting comfortable with a company's numbers. None of them proves fraud on its own of course but together, they give you a holistic view whether management is a steward of your capital or a storyteller.
1: The Beneish M-Score crosses –1.78
The starting point for any read of a company’s financials is the Beneish M-Score, the model Professor Messod Beneish introduced in his 1999 paper “The Detection of Earnings Manipulation.” It's a logit regression built from eight financial statement variables and it compresses them into a single score, typically comparing 2 periods.
The cutoff to remember is –1.78. Score above it, say –1 or 0, and the company is probably manipulating earnings. Score below it and the earnings sit in the safe zone. Beneish chose –1.78 because it gave the best trade-off between false positives and false negatives and historically the Beneish M-score has flagged around half of known manipulators before the fraud became public.

The image uses the profitability metrics of Blackstone Inc., ticker BBN.F, updated as of September 2026.
I use the Beneish M-Score as a screening tool, not a verdict which is also the reason why the surface it as the first metric in the fundamental analysis screen in Vinley. A company above the threshold deserves closer scrutiny but as said earlier it is not an automatic signal of fraud. Once you are past the headline number, it's worth checking which of the eight underlying variables is driving it, since each one points to a different kind of behavior:
1.1 DSRI (days sales in receivables) where a spike often means revenue is being recognized before the cash or before it's real.
1.2 GMI (gross margin index) above 1 means margins are deteriorating, historically a precursor to manipulation, not a cause of it.
1.3 AQI (asset quality index) above 1 signals a growing habit of capitalizing costs instead of expensing them.
1.4 SGI (sales growth index) where high growth is not a signal of earnings manipulation but fast growers have the strongest incentive to keep the story going.
1.5 DEPI (depreciation index) above 1 suggests assets are being depreciated more slowly, often via a stretched useful life which is an easy way to manipulate non cash earnings.
1.6 SGAI (SG&A index), LVGI (leverage index) and TATA (total accruals to total assets) is the accrual quality trio, with TATA in particular tracking how much of earnings is built on discretionary accounting choices rather than cash.
2: Solvency: Altman Z-Score, Debt to Equity and Interest Coverage
No single solvency ratio tells the whole story, which is why I never look at one in isolation. The combination of the Altman Z-Score, debt-to-equity, and the interest coverage ratio (ICR) is what actually reveals whether a balance sheet can survive a bad year.
2.1 Altman Z-Score: Below 1.8 and the company is heading toward financial difficulty; above 2.99 and bankruptcy is unlikely any time soon. Interestingly, Professor Altman himself said in a 2019 lecture, “50 Years of the Altman Score,” that today's more relevant warning line is closer to 0 than to 1.8. Either way, the Z-Score is only as trustworthy as the financial statements behind it which is exactly why it should always be read alongside the Beneish M-Score.
2.2 Debt-to-equity: High long-term debt and the interest expense that comes with it can turn into real pressure the moment operating conditions soften.
2.3 Interest coverage ratio: This is where credit quality becomes concrete. Above 8x reads as prime, AAA-grade risk. Between 6.5x and 8x is high grade (AA). Between 3x and 6.5x is upper medium grade (A). Between 2.5x and 3x is lower medium grade (BBB). Between 1.25x and 2.5x, the company is in speculative territory and its debt structure, fixed versus variable rate, deserves a closer look. Below 1.25x, it's effectively in default risk territory with very low odds of recovery.
3: Profitability: ROIC and ROA
A business can grow revenue for years while quietly destroying value, if it can't earn a decent return on the capital it's deploying. That's what Return on Invested Capital (ROIC) and Return on Assets (ROA) are for.
The bar I personally use by listening to Warren Buffett and Charlie Munger : ROIC above 8–10%, sustained for at least three to five consecutive years. Companies with a durable competitive moat tend to clear both thresholds year after year almost by default. A company that consistently falls short isn't a fraud but it is very often a low-quality or commodity-like business where management is reinvesting shareholder capital at a rate that barely meets its cost of capital.
The trend matters as much as the level. A single weak year can be a cyclical dip. A multi-year slide in ROIC while the company keeps reinvesting at the same pace is a capital allocation problem hiding behind a growth story.
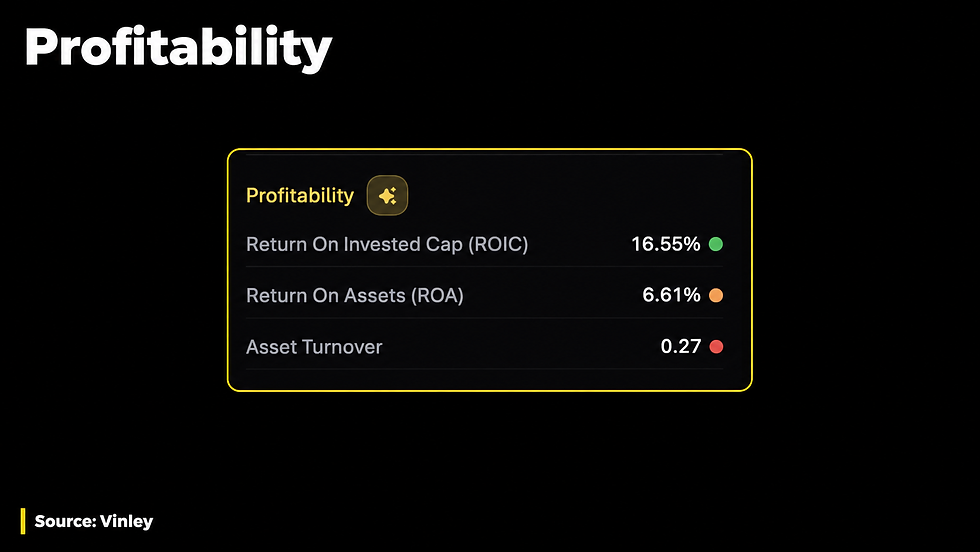
The image uses the profitability metrics of Blackstone Inc., ticker BBN.F, updated as of September 2026.
4: Dividends the company cannot afford
Dividend policy is one important signal for mature companies into how management treats shareholders. I consider the healthy range for a dividend payout ratio to be between 30% to 70%. Below 30%, and typically for companies that pay no dividend at all, management is reinvesting profits to compound long-term value, which is perfectly fine for a high-growth business.
Above 70% is where it turns into an orange flag. It only takes one or two softer earnings quarters for the payout to become unsustainable. If the dividend payout ratio is above 100%, management is handing shareholders more cash than the business actually generated. That is most likely shareholder value destruction, plain and simple, and it usually signals a preference for keeping shareholders happy in the short term over protecting the company and the shareholders in the long term.
The dealbreaker version of this test is when a company is raising debt specifically to keep the dividend flowing. At that point, management is not returning capital, worse, it is borrowing money hence increase the company’s debt to maintain appearances and shareholders happy, and that's a line I treat as absolute inacceptable hence a red flag for me.
5: Customers and employees quietly walking away: NPS and eNPS
Long before deteriorating sentiment shows up in the income statement, it usually shows up in how customers and employees actually talk about the company. That's the logic behind tracking the Net Promoter Score (NPS) for customers and the Employee Net Promoter Score (eNPS) for staff, alongside supporting metrics like CSAT, customer loyalty, CEO approval, and positive business outlook.

The NPS and eNPS metrics are from the company Apple, updated as of September 2026. The approach borrows directly from Phil Fisher's “scuttlebutt method,” described in “Common Stocks and Uncommon Profits” and endorsed by Warren Buffett as a way to stress-test a thesis by talking to competitors, customers, suppliers, and current and former employees, rather than a substitute for fundamental research.
There's real academic weight behind this too. Alex Edmans' study on job satisfaction and firm value found that companies on the “100 Best Companies to Work For in America” list generated 2.3% to 3.8% higher annual stock returns than their peers between 1984 and 2011, a result that held up even after controlling for risk and industry. A company where both scores are sliding, not just low but visibly getting worse, is often flashing a warning well before the next earnings release confirms it.
6: What the auditor is actually telling you
The auditor's opinion, usually tucked into Items 9, 9A and 9B of a 10-K, is one of the most under-read sections of any annual report. Under ISA 700, an auditor issues one of four opinions: unqualified (clean), qualified (fairly presented except for a specific, non-pervasive issue), adverse (materially and pervasively misstated), or a disclaimer (the auditor couldn't gather enough evidence to form a view at all). Anything but a clean opinion deserves your full attention.
Beyond the headline opinion, I watch for a cluster of related audit signals:
6.1 Disagreement with management over accounting policy choices, estimates and judgments (bad debt provisions, impairments, tax reserves), disclosure completeness, or an overly optimistic going-concern outlook.
6.2 Critical Audit Matters (CAMs) under PCAOB AS 3101, or Key Audit Matters (KAMs) under ISA 701 internationally which are the specific areas the auditor found most subjective or complex to sign off on.
6.3 Auditor tenure. The same firm, never rotated, for many years running. Familiarity can breed comfort, and comfort is the enemy of neutrality and professional skepticism.
6.4 Non-audit fees. General practice treats staying under roughly 30% of total fees as the line for auditor independence, but personally I look for something much tighter, in the 10–15% range. An auditor is supposed to scrutinize a client independently. When that same auditor also earns significant consulting income from the client, you get, at least the appearance of a conflict of interest if not an effective conflict of interest. 7: Accounting policies that keep getting more “flexible” Some of the most damaging manipulation never touches the cash flow statement at all, it just quietly reshapes non-cash earnings that are reflected in the income statements. Watch for shifts in accounting policies and more specifically the first accounting policy items like revenue recognition (moving from point-in-time to a percentage-of-completion model, for instance), or an extension of an asset's useful life that slows depreciation and flatters near-term profit, exactly what Beneish's DEPI variable is designed to catch. A rising AQI, meanwhile, points to a growing habit of capitalizing costs that should really be hitting the income statement.
The textbook case is WorldCom, which capitalized billions of dollars in ordinary line costs, operating expenses, as long-term assets, spreading them over years instead of taking the hit immediately. It artificially boosted earnings for years and concealed the company's real financial position, until it didn't.
The pattern to look in the policy change is a company that changes its accounting policies more often than its peers, always in the direction of a better-looking number.
8: A boardroom that answers to no one Governance structure shapes how much real oversight a company actually has. In 1-tier governance models, more common among US companies, the CEO often also chairs the board. In 2-tier models, more typical in Europe, the CEO isn't a board member at all, which allows for a cleaner, more independent check on management.
Research by Anil Shivdasani and David Yermack found that when the CEO sits on, or effectively controls, the nominating committee, companies end up appointing fewer truly independent directors and more “gray outsiders,” personal attorneys or consultants with existing ties to management.
The extreme version of this failure was FTX, where Sam Bankman-Fried presided over a board with essentially no independent oversight and no experienced finance professionals in the room. To be fair, that level of governance breakdown is rare among publicly listed companies, which face baseline listing and disclosure requirements FTX never had to meet. Still, it's worth checking who actually sits on the board, how independent they really are, and whether the CEO controls who gets nominated.
9: When management starts talking in fog
Complexity is sometimes just complexity and may vary between company industries. But when management's language gets denser when amongst others performance gets weaker, it's worth asking whether the jargon is doing some of the work that clear numbers used to do. The specific terms to watch for are heavy, repeated use of “non-GAAP,” “adjusted,” “pro forma,” and mark-to-market figures. Each has a legitimate use. Used constantly, together, they can also be a way of steering attention away from the GAAP number that tells the less flattering story.
This is measurable, not just a feeling. Financial-specific tools like the Loughran-McDonald sentiment dictionary (built for financial disclosures, scoring language across seven categories from negative and positive to litigious and uncertain) and a dedicated complexity dictionary that scores disclosures as a percentage of complex terms to total words, both show a real pattern: rising textual complexity has correlated with weaker subsequent stock performance, and the frequency of non-GAAP language in particular has stood out as one of the more reliable predictors of underperformance.
The trend is the signal. A jump in jargon density from one filing to the next, without a corresponding jump in complexity of the underlying business, is worth a second read of the actual GAAP numbers. 10. Related-party transactions that don't pass the arm's-length test
Any transaction between the company and a party connected to management, the board, or major shareholders deserves scrutiny in case it was not negotiated at arm's length. These deals can quietly move value in or out of the company in ways an ordinary line item never would.
The example that captures it best is Adam Neumann, WeWork's co-founder, who sold the trademark for the word “We” to his own company for roughly $5.9 million while serving as both CEO and a major shareholder. The obvious conflict of interest triggered enough public backlash that he returned the money, but it's a near-perfect illustration of how related-party deals can benefit an insider at the expense of everyone else on the cap table. In a 10-K, this is Item 13, “Certain Relationships and Related Transactions, and Director Independence,” and it's one of the least-read, most revealing sections in the entire filing. Putting it all together No single one of these ten checks will catch every problem, and none of them is proof of fraud on its own. What they give you, taken together, is a picture of whether management is compounding your capital responsibly or managing the story around it.


.png)


Comments