
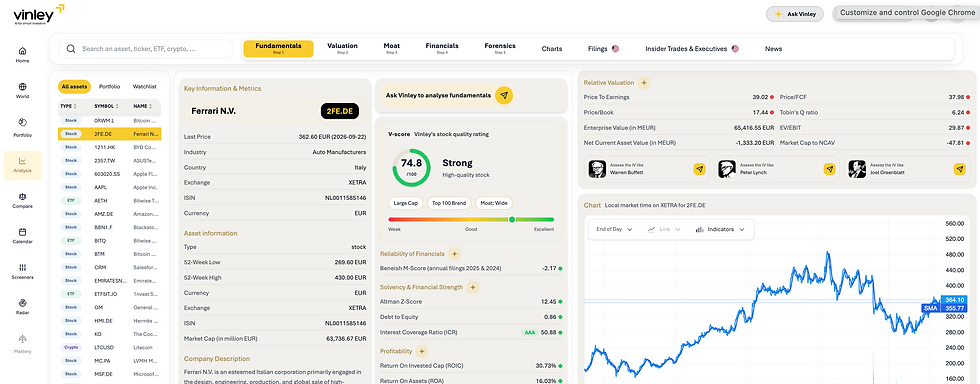
Vinley vs Stock Analysis in 30 Seconds
Both platforms support fundamental investors, but they serve different parts of the research process.
Choose Vinley when you want to understand the investment
Vinley is better suited to investors who prioritise:
-
Multiple intrinsic valuation methods
-
Margin-of-safety analysis
-
Forensic accounting indicators
-
AI-supported financial interpretation
-
Brand, customer and employee signals
-
Audit-opinion and earnings-language analysis
-
Portfolio exposure analysis
Vinley lets you analyze within seconds the DCF, DFE, DDM, EV/EBIT and EPV valuation, as well as Beneish M-Score, Altman Z-Score, Benford’s Law and Sloan Ratio analysis.
It also includes NPS, eNPS, brand valuation, audit-opinion analysis and a natural-language companion.
Choose TIKR when you want to search and monitor a larger stock universe
TIKR is better suited to investors who prioritise:
-
A large global equity screener
-
Long historical financial datasets
-
Wall Street analyst estimates
-
Earnings transcripts and company filings
-
Custom market-news feeds
-
P/E-based scenario modelling
-
Detailed financial charting
TIKR states that it covers more than 100,000 stocks across 92 countries and 136 exchanges and offers thousands of screening filters, historical financials, forecasts, transcripts, filings and portfolios from more than 10,000 investment funds on higher plans.
The Verdict
TIKR is stronger for discovering, filtering and monitoring stocks across a very large universe. Vinley is stronger for guided value-investing analysis, multi-method intrinsic valuation and accounting-risk interpretation all focused on valuation risk
Area Vinley TIKR
Best fit
Investors who want a structured approach to valuation, business quality and accounting risk.
Valuation
Multiple valuation methods and margin-of-safety analysis, available through Plus.
Valuation ratios, with Graham Number and Lynch Fair Value shown as upgrade features. Stock example.
Risk checks
Plus includes Beneish M score with its sub-variables, Sloan and Benford accounting analysis
Stock statistics include Altman Z-Score and Piotroski F-Score.
Research assistance
An AI companion for questions about companies and financial information.
Earnings-call transcripts with AI summaries and audio playback. Release notes
Getting started
Free Basic plan; valuation and forensic analysis require Plus.
Free access; Pro adds longer financial history, downloads and saved screens. Plans
Verdict
Choose Vinley if you want to test a company's valuation and investigate the quality of its reported earnings within one research process. Its combination of valuation methods, sensitivity analysis and forensic checks makes it a relevant choice for that work.
Choose Stock Analysis if your priority is gathering, comparing and exporting financial evidence for your own analysis. Its screeners, comparison tools and documented data sources are particularly relevant to investors who already have a research method or spreadsheet model. The choice depends on how you research a company. Neither platform guarantees a better investment outcome.
Vinley vs Stock Analysis: Detailed comparison
Area Vinley Stock Analysis
Accounting and financial-risk checks
Vinley Plus includes Beneish M-Score, Sloan and Benford analysis. Vinley also lists Altman Z-Score.
Valuation methods
DCF, discounted future earnings, dividend discount, EV/EBIT and earnings power value, with growth and cost-of-capital sensitivity analysis. Intrinsic valuation requires Plus
Customer, employee and brand information
NPS, eNPS, brand valuation and industry-cluster analysis.
AI-supported research
Natural-language companion in Basic and Plus plans; traffic-light signals help interpret financial metrics, including an AI specialized chat box for deeper interpretation.
AI summaries of earnings-call transcripts, with audio and speaker-by-speaker views. Release notes
Screening and discovery
Plus includes Graham, EV/EBIT and NCAV undervaluation searches.
Financial history
Financial statements and metrics are included in Basic for up to 10 years. Company availability varies.
Paid history varies by provider: up to 10 years from S&P, 20 from Fiscal AI, 30+ from Nasdaq Data Link and 40+ from FMP. Company availability varies. Breakdown
Published coverage
40,000+ companies across 60+ exchanges, alongside fund and crypto research.
130,000+ tradable stock and fund symbols globally. These are symbols, not a count of distinct companies. Coverage
Portfolio tools
Plus includes exposure analysis by currency, industry and geography
Pro includes portfolios and brokerage-holdings synchronization; supported brokers are listed separately. Plans, broker list
Data downloads
A comparable spreadsheet-download allowance is not publicly listed on the pricing page.
Pro allows one download per day; Unlimited removes that daily limit. Provider restrictions still apply. Plans, restrictions
Pricing
A comparable spreadsheet-download allowance is not publicly listed on the pricing page.
Pro allows one download per day; Unlimited removes that daily limit. Provider restrictions still apply. Plans, restrictions
What can you do with Vinley that Stock Analysis does not publicly list?
1. Investigate earnings quality with a dedicated forensic toolkit.
Vinley Plus combines Beneish, Sloan and Benford analysis to flag matters worth examining in the accounts. These indicators help direct further research; they do not establish fraud. Stock Analysis lists financial-health scores but does not publicly list the same forensic suite.
2. Test how much your valuation depends on your assumptions.
Vinley's sensitivity analysis lets investors examine changes in growth and cost of capital. The practical question is whether a valuation remains attractive under less favourable assumptions. Stock Analysis's public tools do not list an equivalent adjustable multi-method workflow.
3. Bring customer, employee and brand evidence into the assessment.
Vinley includes customer NPS, employee eNPS and brand information alongside company research. These can inform questions about business quality, with availability depending on the company. Stock Analysis does not publicly list an equivalent combined dataset.
Where Stock Analysis may be a better choice
You build your own financial models. Stock Analysis documents its data providers and supports downloads for spreadsheet work. Check the source when reconciling figures: exports can differ from the displayed data because S&P data cannot be downloaded. Download methodology.
You need long financial histories. Alternative providers offer histories extending beyond ten years, where available. That can be useful when studying a business through different economic conditions. Historical-data coverage.
You follow analyst expectations. Stock Analysis publishes consensus ratings, price targets and financial forecasts sourced from S&P Global, with individual analyst data from TipRanks. These provide another reference point for your own assumptions. Data sources.
You want to keep holdings connected to your research. Its brokerage integration supports holdings synchronisation from named providers, including Interactive Brokers, Fidelity and DEGIRO. Check the supported-broker list before subscribing for this feature. Brokerage integration.
Conclusion
Vinley deserves a place on your shortlist if valuation assumptions, earnings quality and business-quality signals are central to your research. Stock Analysis deserves a place if historical data, screening, analyst expectations and spreadsheet work matter most. Choose the platform that helps you answer the questions you ask before investing.
Put your next company through a closer examination.
No credit card required. Intrinsic valuation and forensic analysis are available with Plus.
